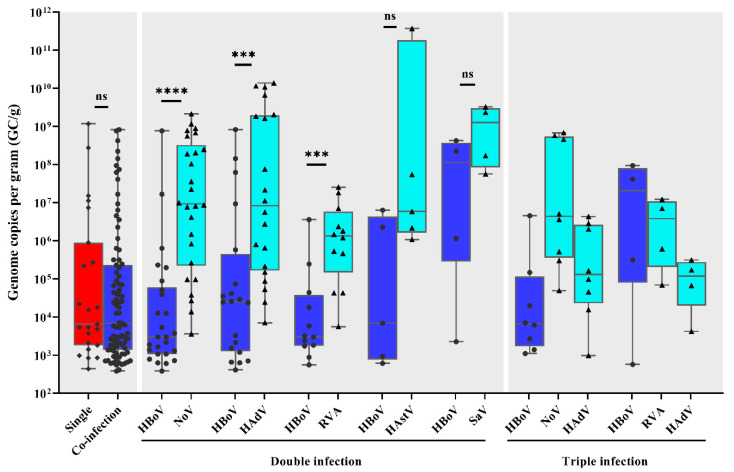
Figure 3.
Human bocavirus (HBoV) viral load among single and co-infections, and analysis of enteric viruses’ viral load among HBoV-positive co-infected samples. Box-and-whisker plots show the first and third quartiles (equivalent to the 5th and 95th percentiles), the median (the horizontal line in the box), and range of HBoV viral load concentrations, expressed as genome copies per gram of stool (GC/g). ns, not significant; *** p ≤ 0.001; **** p ≤ 0.0001.

