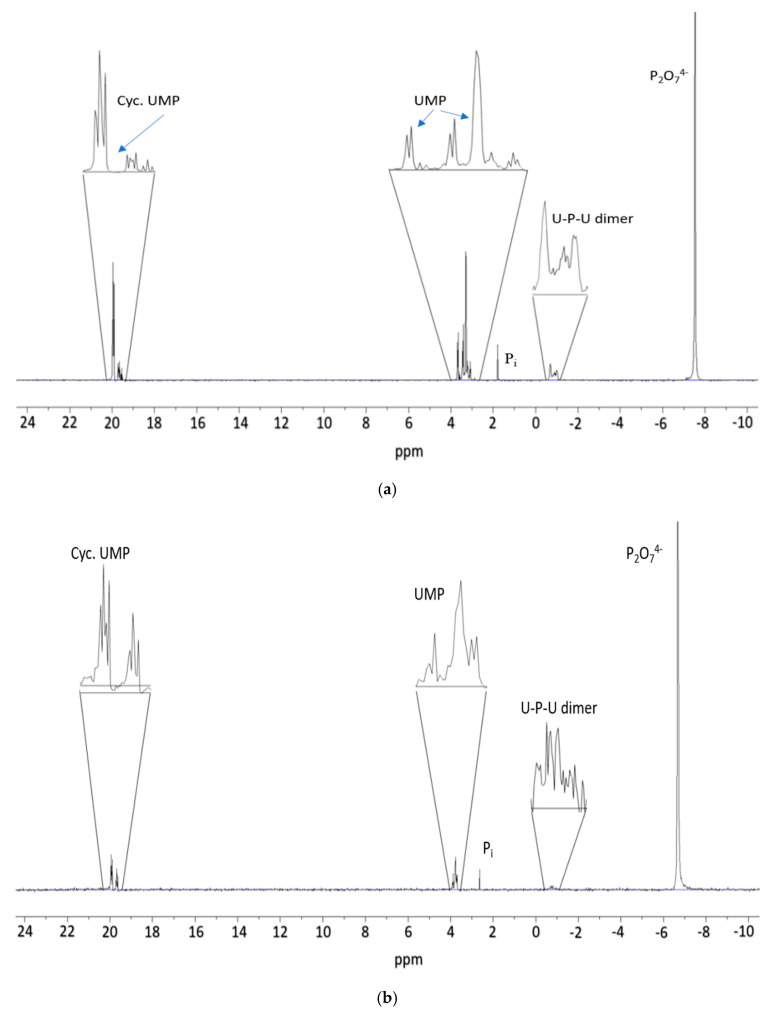
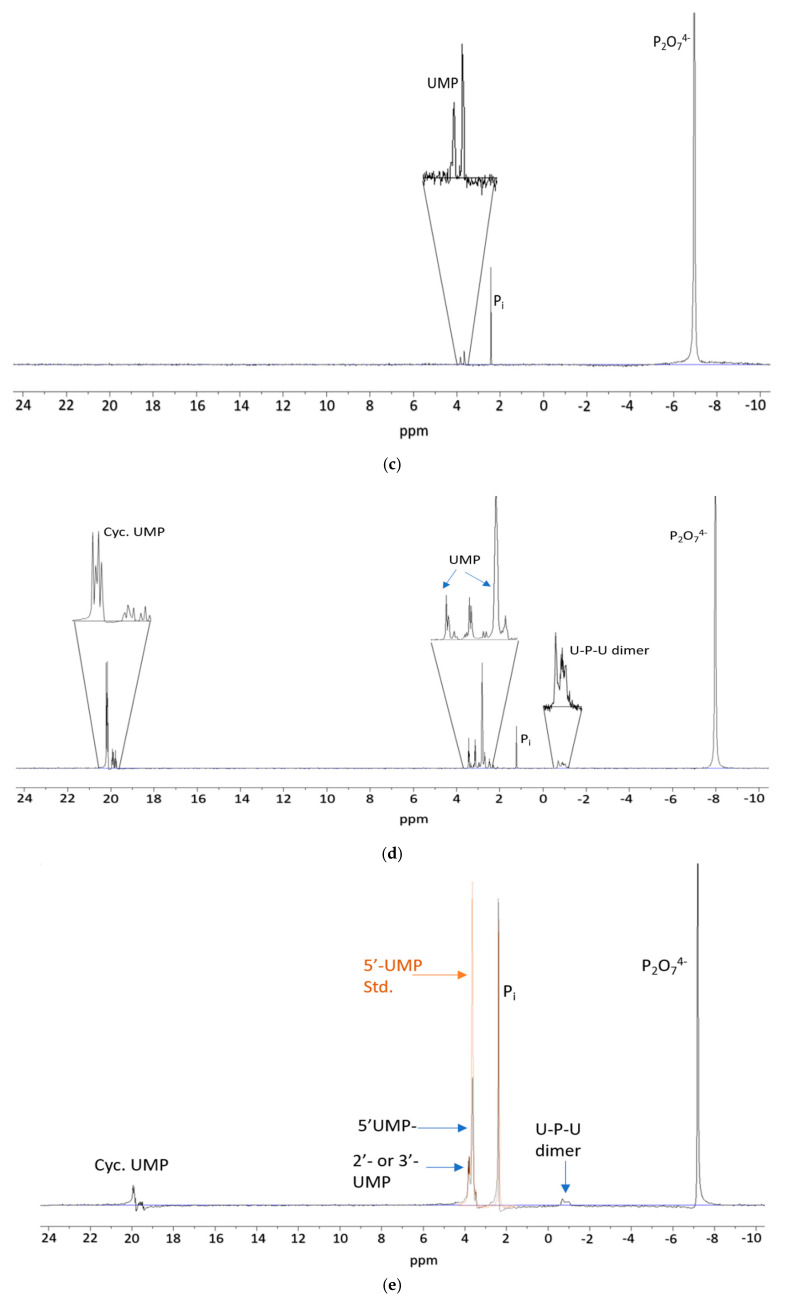
Figure 2.
Phosphorylation reactions of uridine with pyrophosphate; (a) shows the proton coupled 31P-NMR spectrum of sample 1 with highest yields of the phosphorylated products. From right to left: around −8 ppm the peak shows pyrophosphate, the peak area between 0 and −2 ppm shows the U-P-U dimer species while around 1 ppm shows the orthophosphate (Pi) and between 2–4 ppm the uridine monophosphates including 5′-UMP, 2′-UMP as well as 3′-UMP, respectively. The peak area around 19–20 ppm corresponds to cyc. UMP. This reaction was supported by urea, white sand, and Mg2+ ion and at 60–65 °C. (b) shows the proton coupled 31P-NMR spectrum of sample 8 carried out in the presence of Mg2+. Moving from right to left, dimer species U-P-U is still seen but less than in sample 1. (c) represents the proton coupled 31P-NMR spectrum of sample 10 “without” any additive material, and shows drastic decline in the yield of the phosphorylated products. (d) shows the proton-coupled 31P-NMR spectrum of sample 6 carried out at 70–75 °C and by using urea, sand, and Mg2+ ion mixture. Like sample 1 (a), sample 6 showed best possible yields of the phosphorylated products. (e) shows the results of spiking the sample with 5′-UMP to identify and match the major product. The black spectrum is the sample, whereas the orange spectrum in the figure represents the sample containing 5′-UMP standard.


