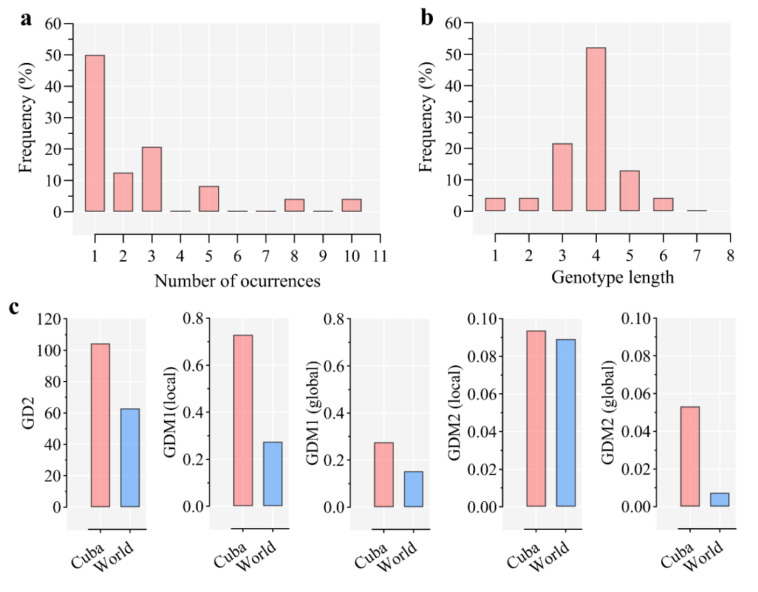
Figure 3.
Genetic diversity analysis of A. marginale strains in western Cuba. (a) TRs frequency. (b) Genotype length distributions. (c) Genetic diversity (GD) metrics compared between strains from Cuba and world; GD2, represents the ratio between unique SSRs and the number of strains in a region; GDM1 also considers the number of unique SSRs in a region but is independent of the length of the genotype; and GDM2 measures how uniformly the SSRs occurrences in a region are distributed. GDM1 and GDM2 are presented in both local and global variants, in which the metrics are calculated as an average of the values for each genotype or over the entire region, respectively [147].

