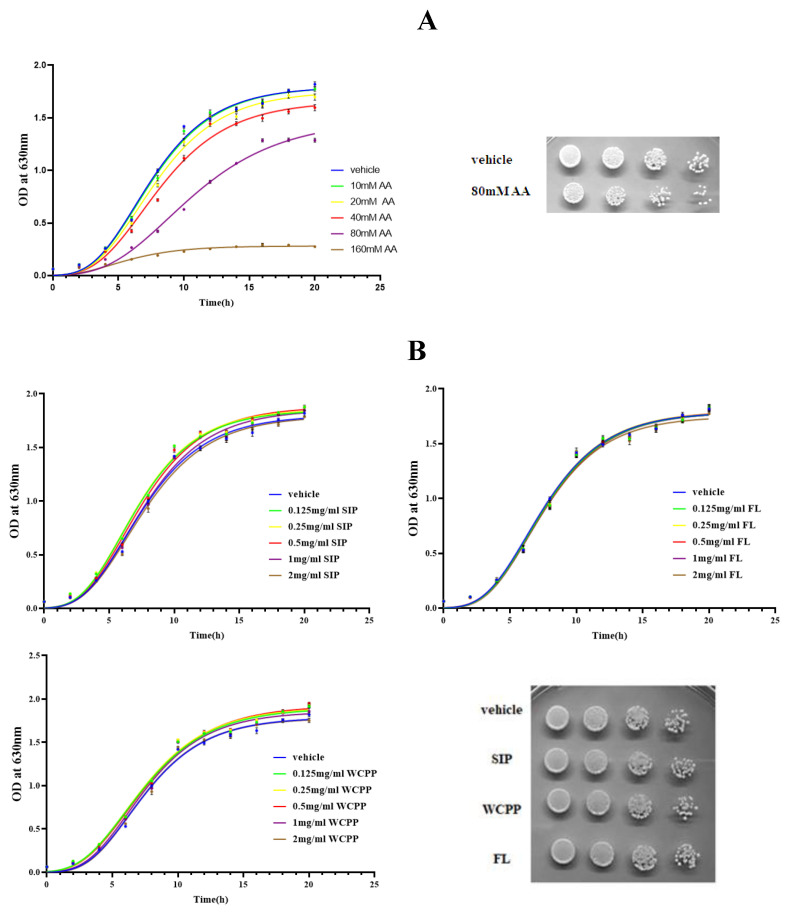
Figure 1.
(A) Growth curve of yeast under AA administration at concentrations of 10, 20, 40, 80 and 160 mM and the growth of yeast after cultured 6 h in the presence of AA at 80 mM using spot assay. (B) Growth curve of yeast under SIP or FL or WCPP administration at concentrations of 0.125, 0.25, 0.5, 1 and 2 mg/mL and the growth of yeast after cultured 6 h in the presence of SIP or FL or WCPP at 0.5 mg/mL using spot assay.

