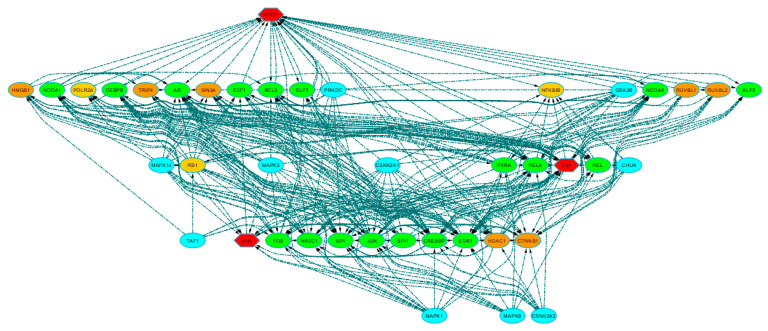
Figure 3.
Extended regulatory network. The network shows the relationships (directed dashed edges) among the hub transcriptional factors, the additional proteins inferred by protein–protein interactions, and the most significant kinases identified by kinase enrichment analysis. Node shapes distinguish hub TFs (hexagon) from all the other inferred proteins (ovals). Node colors reflect node types or functions: hub TFs = red; inferred TFs = green; kinases = light blue; TcoFs = orange; inferred molecules with other functions = light orange. Also see Data Supplement 1d for detailed annotation.

