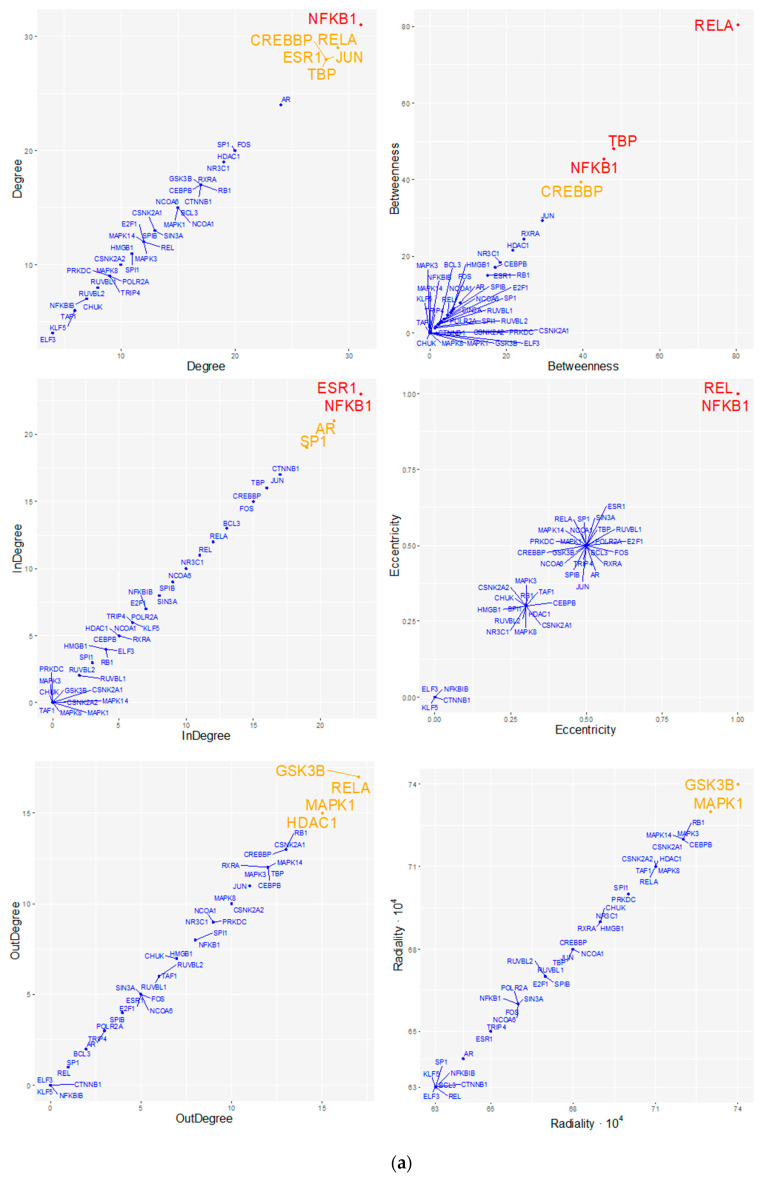
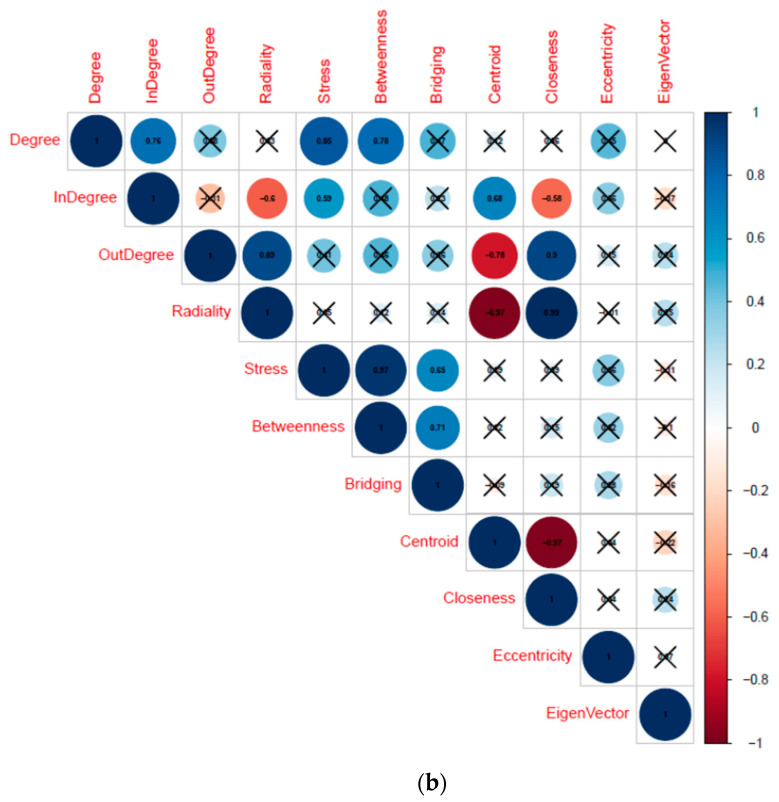
Figure 4.
(a) Topological analysis of the extended regulatory network. Each panel represents the scatterplot of the index-over-index topological measures calculated for the extended regulatory network. To draw the representative scatterplots, only one index was chosen among those that were highly correlated and with very similar meanings. The presence of a non-uniform distribution of nodes, with most nodes having a low index and a few having a high index, identifies those nodes that clearly differ from the average measure of the index throughout the network (red and orange dots or labels). Red, orange, and blue colors, respectively, refer to nodes with z-scores > 2.0, between 1.5 and 2.0, and <1.5. Detailed results are reported in Data Supplement 1e. (b) Correlation plot of the topological indexes. Indexes with similar meanings show a highly significant Pearson’s correlation (p-values < 0.001). Numbers and circle sizes (from smaller to bigger) refer to correlation coefficient r values. Positive and negative correlations are displayed by a gradient color from white (low) to blue (high) and from white (low) to red (high), respectively. To simplify visualization, crosses mark non-significant correlations.


