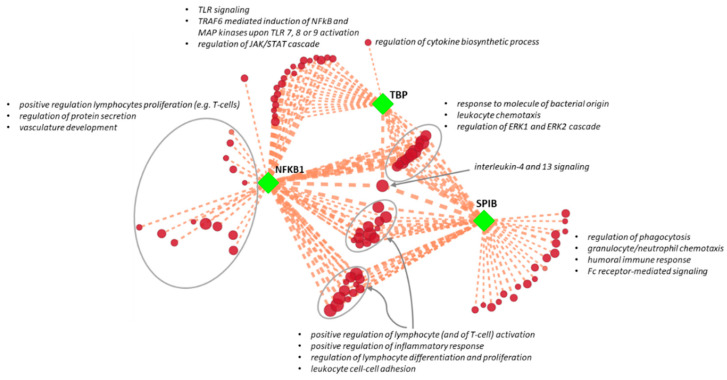
Figure 5.
Enrichment network of transcriptional clusters. NFKB1, SPIB, and TBP transcriptional clusters (squared green nodes) and pathogenetic Gene Ontology–biological process (GO-BP) pathways associated with abdominal aortic aneurysm perivascular adipose tissue (red nodes) are connected by dashed orange edges, which indicate significant overlaps between two gene sets. Edge thickness (from thinner to thicker) is proportional to the number of overlapping genes. GO-BP pathway node colors (from lighter to darker) and sizes (from smallest to bigger) are proportional to the original normalized enrichment score calculated by gene set enrichment analysis. Groups of redundant gene sets were manually circled and labeled by relevant overview GO-BP pathways terms.

