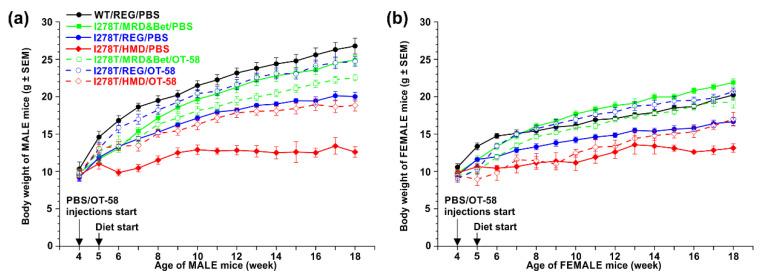
Figure 2.
Comparison of the weight of WT and I278T mice over the course of the study. Males and females are shown separately in panels (a) and (b), respectively. WT controls were maintained on the REG diet and PBS injections (black), while I278T mice were on the MRD&Bet/REG/HMD diet (green/blue/red) receiving subcutaneously either PBS (closed symbols and solid lines) or OT-58 (10 mg/kg, open symbols and dashed lines). Data points represent average values and error bars show SEMs. Statistical significance was determined by using ANOVA, and for the sake of clarity, is mentioned only in the main text.

