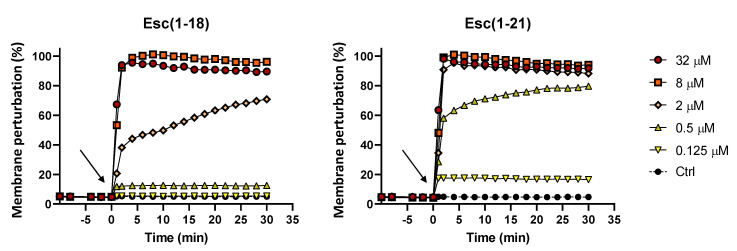
Figure 2.
Membrane perturbation assay performed with the Sytox Green dye. The percentage of membrane damage was calculated with respect to the maximum membrane permeabilization obtained with the highest peptide concentration (32 µM) and the addition of 1 mM EDTA + 0.5% Triton X-100. Arrows indicate the addition of the peptide. Data points are the mean of triplicate measurements from a single experiment representative of three independent experiments. Controls (Ctrl) are cells not treated with the peptides.

