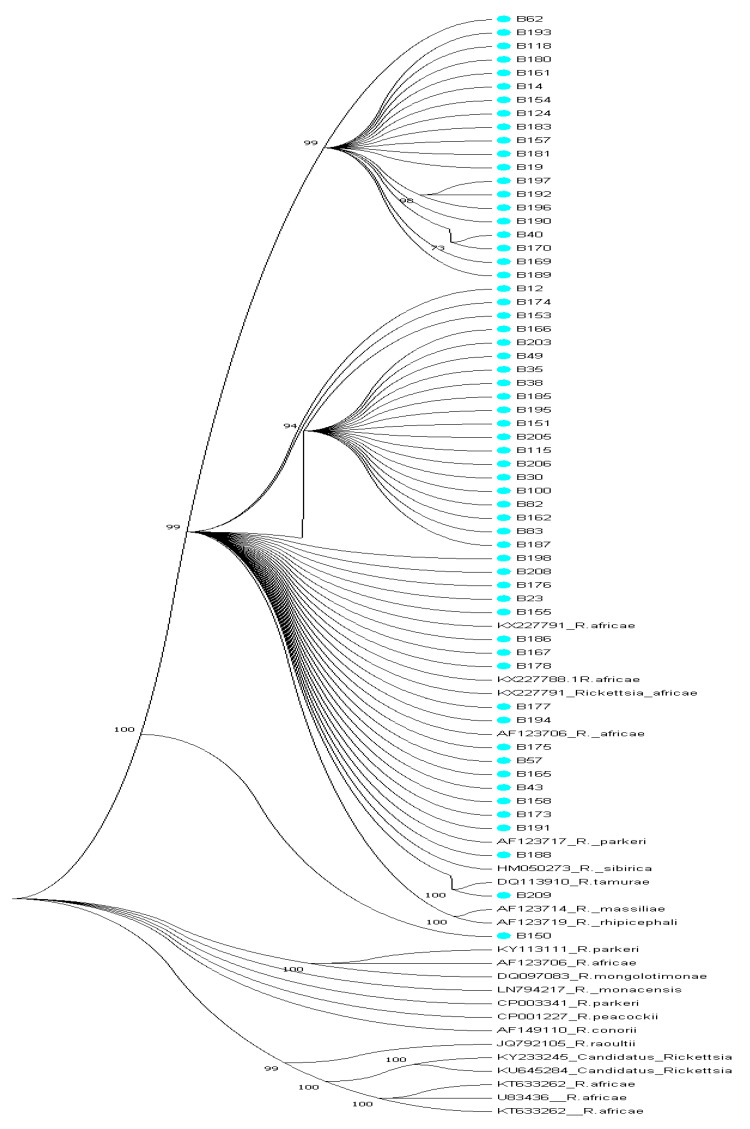
Figure 5.
Phylogenetic tree of ompB gene sequences in bold generated from the study with the related reference sequences obtained from NCBI GenBank. The evolutionary history was inferred using the neighbor-joining method [17]. The optimal tree with the sum of branch length = 2.89828155 is shown. The percentage of replicate trees in which the associated taxa clustered together in the bootstrap test (1000 replicates) is shown next to the branches [18]. The evolutionary distances were computed using the p-distance method [19] and are in the units of the number of base differences per site. The analysis involved 86 nucleotide sequences. Codon positions included were 1st + 2nd + 3rd +Noncoding. All positions containing gaps and missing data were eliminated. There were a total of 236 positions in the final dataset. Evolutionary analyses were conducted in MEGA7 [20]. All study sequences clustered phylogenetically with R. africae sequences from GenBank with the exception of sequences B188 and B209; B188 clustered with R. parkeri (AF123717) while sample B209 clustered with R. tamurae (DQ113910) with high bootstrap values above 99%. Test sequences are in bold in blue dot.

