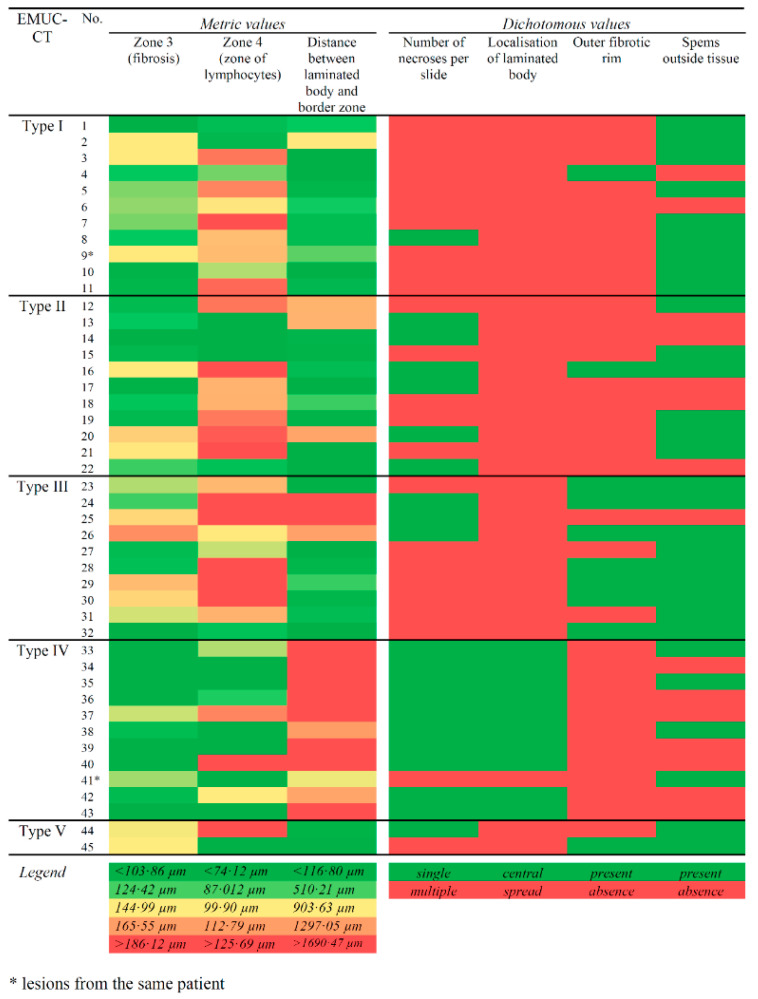
Figure 3.
Heatmap of parameters that showed significant results (p < 0.05) in the five EMUC-CT types of alveolar echinococcosis lesions. (Left) Colours indicate different values of metric values. (Right) Dichotomous measures are indicated with red or green. Legend gives the specific definitions for each colour in each column.

