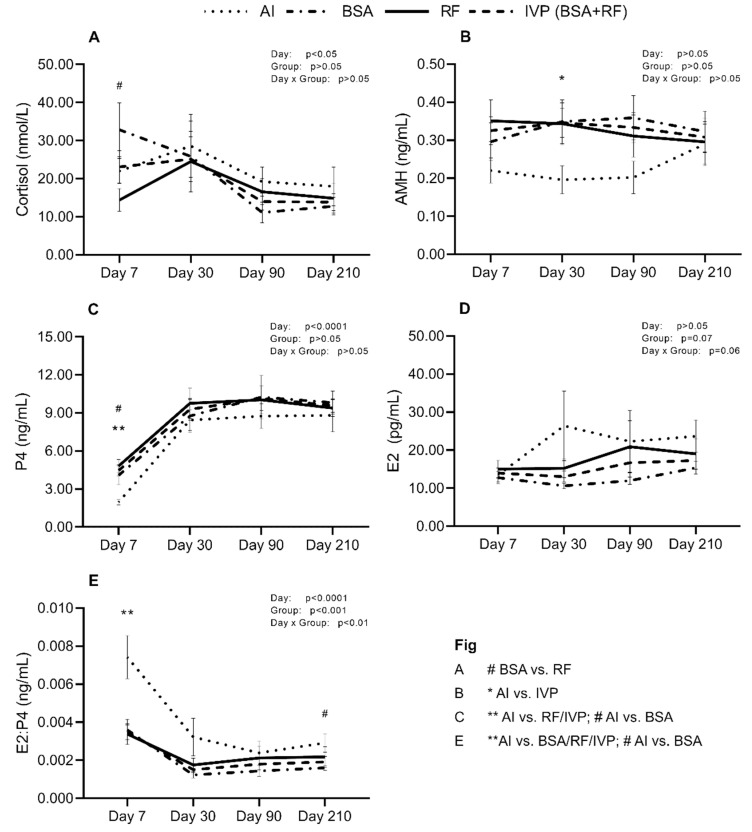
Figure 2.
Distribution of mean ± SEM values, of (A). Cortisol, (B). Anti-Müllerian hormone (AMH), (C). Progesterone (P4), (D). Estrogen (E2) and (E). E2:P4 ratio, in pregnant recipients from artificial insemination (AI) group, bovine serum albumin group (BSA), reproductive fluids group (RF) or in vitro produced (IVP, corresponding of BSA + RF) across gestation time. * p < 0.05, ** p < 0.01 and # p < 0.09.

