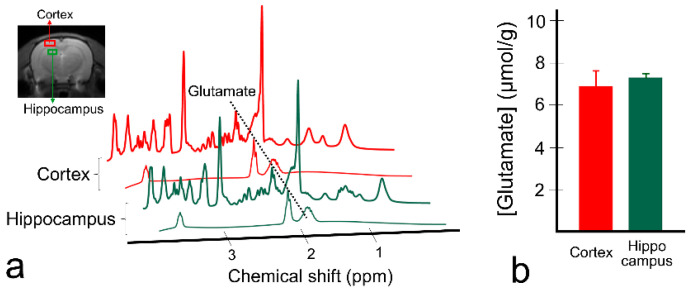
Figure 5.
Fitted spectra results of proton magnetic resonance spectroscopy (1H MRS) in two brain regions (cortex and hippocampus) from a representative rat (a) and quantified glutamate concentrations from the rats (n = 5) scanned with 1H MRS (b). A black-dotted line was placed on the glutamate peak at 2.35 ppm. The bars represent mean values of glutamate concentration, and error bars represent standard deviations.

