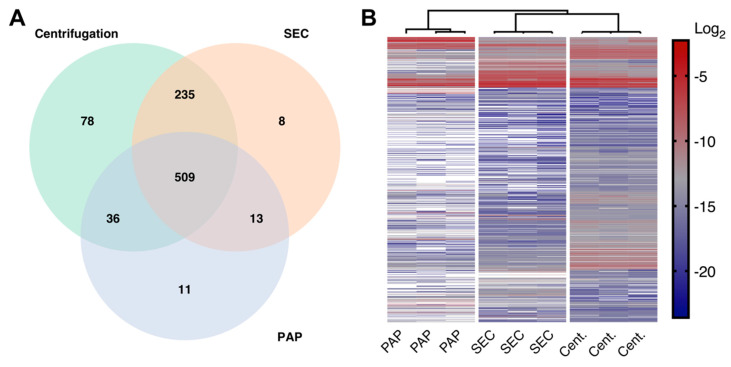
Figure 3.
Differences in the EV proteomes in isolates produced by high-speed centrifugation (Cent.), size exclusion chromatography (SEC), and peptide affinity precipitation (PAP). (A) Venn diagram showing common and unique proteins identified in all three methods. (B) Hierarchical clustering of protein intensities from isolates obtained by high-speed centrifugation, SEC, and PAP showing that the three isolation methods resulted in three distinct EV proteomes. White = missing values.

