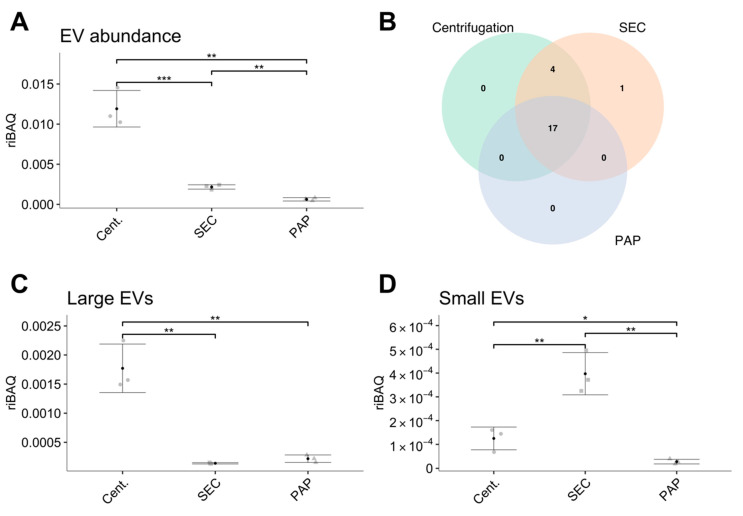
Figure 4.
Differences in the abundance and amount of extracellular vesicle (EV) specific proteins in isolates obtained by high-speed centrifugation (Cent.), size exclusion chromatography (SEC), and peptide affinity precipitation (PAP). (A) The difference in abundance of EV specific proteins. (B) Venn diagram showing the number of identified EV specific proteins per isolation method. (C,D) Comparison of relative abundances of EV subtypes divided into large EVs (C) and small EVs (D). Error bars: Mean ± SD. Significance levels: * (p-value < 0.05), ** (p-value < 0.01), and *** (p-value < 0.001).

