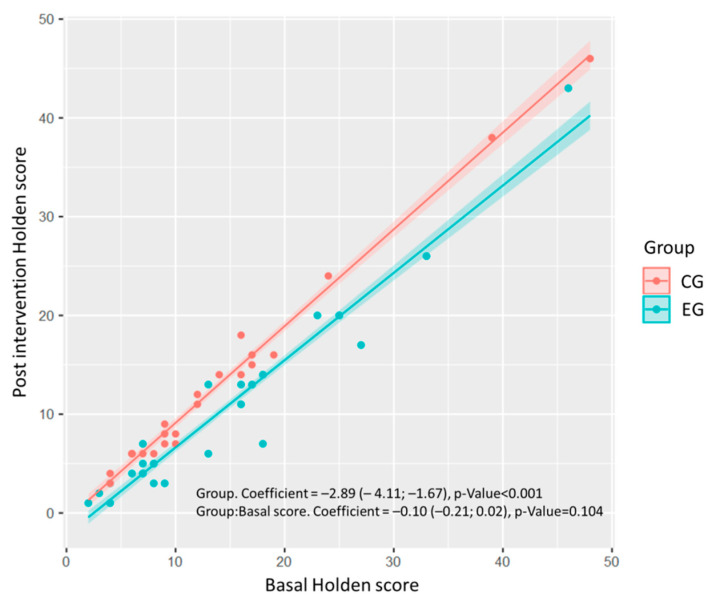
Figure 1.
Linear regression model for the response variable “postintervention Holden score” as a function of the group, basal score, and their interaction. Each point represents the participant observed score, and the lines represent the fitted model and 95% confidence interval. The regression coefficients for the group effect are shown, with their corresponding 95% confidence interval and p-value. CG: Control group, EG: Experimental group.

