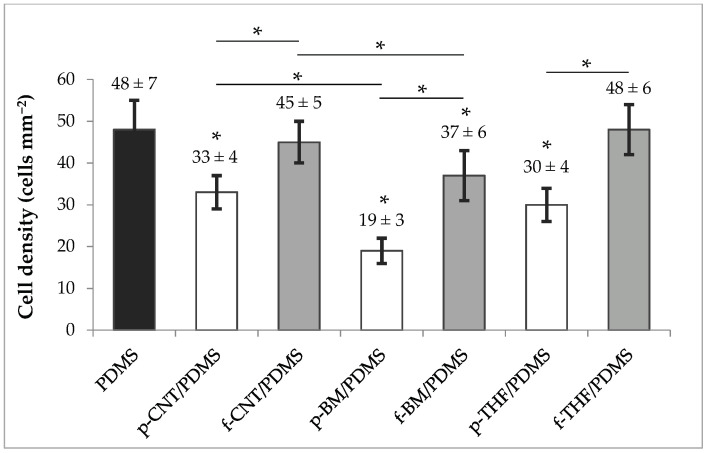
Figure 5.
Bar chart of the average cell densities of PDMS (black bar), p-CNT/PDMS, p-BM/PDMS, and p-THF/PDMS (white bars); and f-CNT/PDMS, f-BM/PDMS, and f-THF/PDMS (gray bars) coatings, obtained with three independent tests. Error bars correspond to standard deviation. * indicates p < 0.0001, and consequently statistically different from the control.

