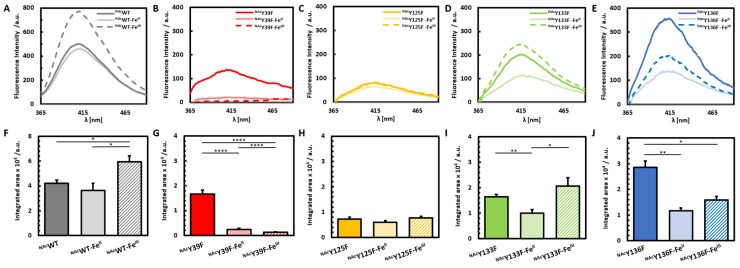
Figure 3.
PICUP analysis of NAcαSyn variants with and without iron added. Fluorescence spectra following PICUP reactions with no metal added (solid-dark), FeII-added (solid-light), and FeIII-added (dashed/striped) of NAcWT (A), NAcY39F (B) NAcY125F (C) NAcY133F (D) and NAcY136F (E). Bar graphs represent the integrated area of dityrosine emission for NAcWT (F), NAcY39F (G) NAcY125F (H) NAcY133F (I) and NAcY136F (J).

