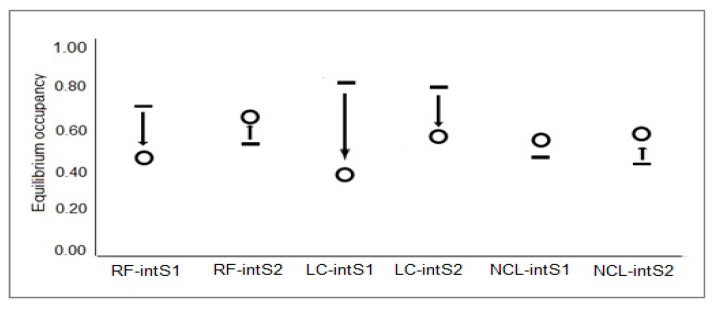
Figure 4.
Occupancy equilibrium (O) in relation to occupancy (▬) of year before interseason over three years within the TNR. Arrows indicate degree and trend of change in occupancy. RF-intS1, red fox Interseason 1; LC-intS1, leopard cat Interseason 1; NCL-intS1, North Chinese leopard Interseason 1; RF-intS2, red fox Interseason 2; LC-intS2, leopard cat Interseason 2; NCL-intS2, North Chinese leopard Interseason 2.

