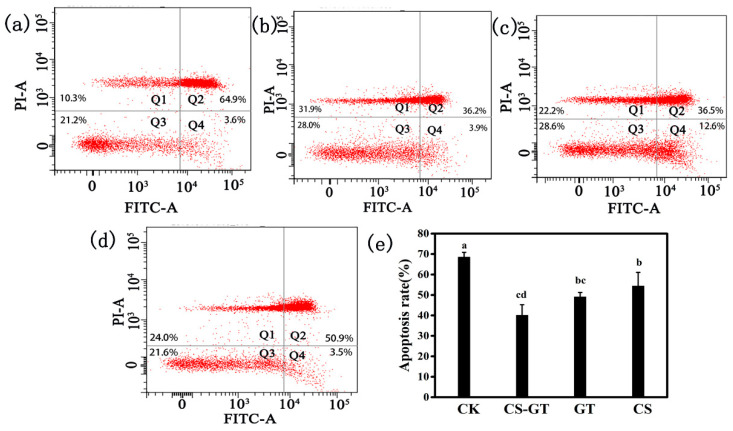
Figure 3.
Flow cytometry detection of hemocyte apoptosis in (a) CK, (b) CS-GT, (c) GT, and (d) CS groups, and (e) hemocyte apoptosis rate (mean ± SD, n = 6). CK: Infected with Vibrio parahaemolyticus group; CS-GT: Supplemented with CS-GT after infection with Vibrio parahaemolyticus group; GT: Supplemented with GT after infection with Vibrio parahaemolyticus group; CS: Supplemented with CS after infection with Vibrio parahaemolyticus group. (different letters indicate significant differences between the different groups at the same time point (p < 0.05)).

