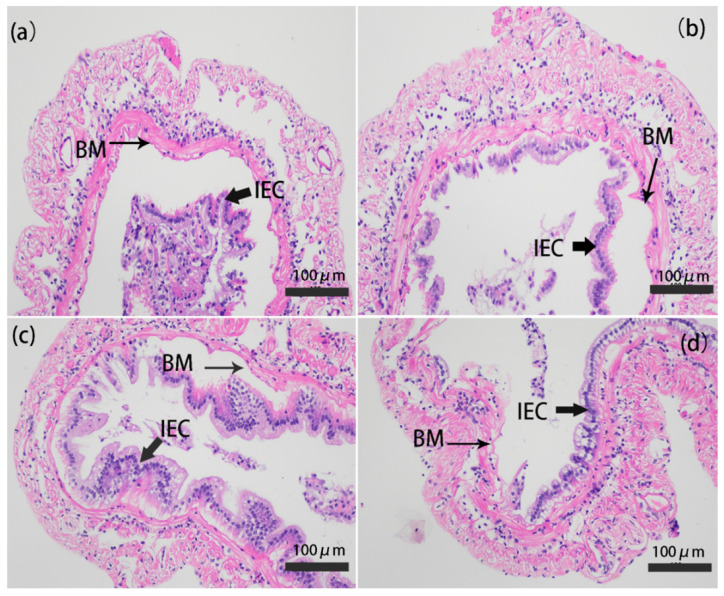
Figure 6.
Photomicrographs of gut cross-cutting in (a) CK, (b) CS-GT, (c) GT, and (d) CS groups (mean ± SD, n = 3). The magnification was 200×, and the scale bar represents 100 µm. CK: Infected with Vibrio parahaemolyticus group; CS-GT: Supplemented with CS-GT after infection with Vibrio parahaemolyticus group; GT: Supplemented with GT after infection with Vibrio parahaemolyticus group; CS: Supplemented with CS after infection with Vibrio parahaemolyticus group; IEC: Intestinal epithelial cells; BM: Basement membrane.

