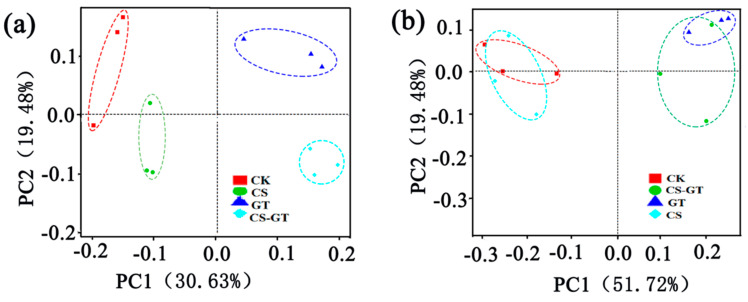
Figure 8.
Principal coordinates analysis (PCoA) plot based on weighted-UniFrac analysis of water (a) and guts (b) of shrimp (n = 3). The abscissa represents one principal component, the ordinate represents another principal component, and the percentage represents the contribution of the principal component to the sample difference.

