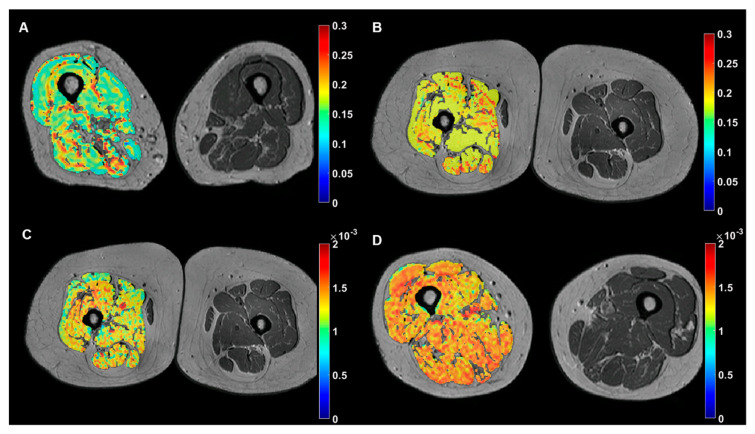
Figure 2.
Examples of representative color-coded imaging biomarkers of the dominant leg muscle overlapped on anatomic MR images of the thighs. Top row: microscopic fat infiltration (PDFF, no units) maps showing lower values for a subject with relatively low fat mass (A) in comparison with a subject with high fat mass (B). Bottom row: muscle hydration maps ((D), mm2/s) showing lower values for a subject with IPAQ 1 (C) in comparison with a subject with IPAQ 2 (D).

