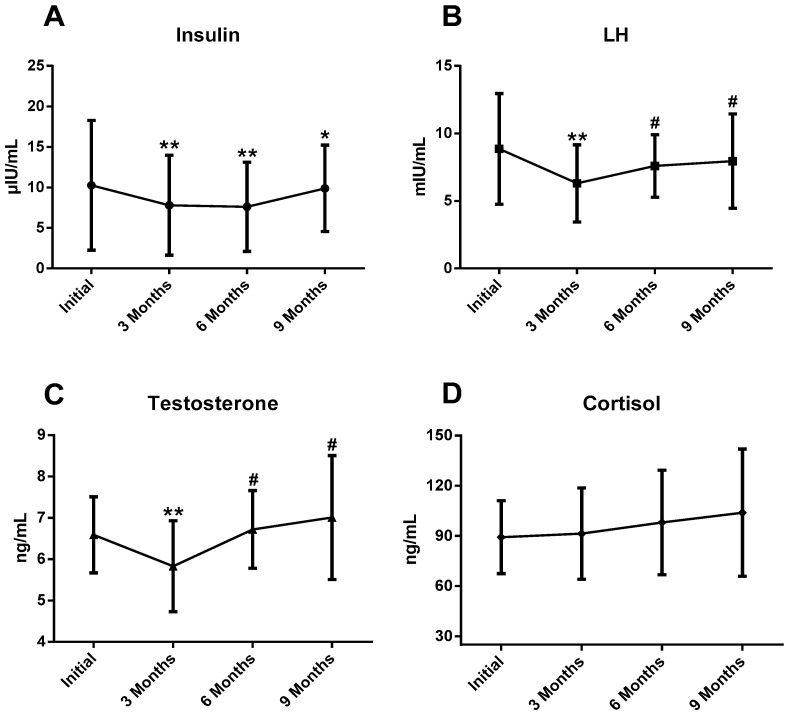
Figure 2.
This figure shows the key findings. (A) Insulin changes during season; (B) LH changes during season; (C) testosterone changes during season; (D) cortisol changes during season; LH: luteinizing hormone; * p < 0.05 differences between initial vs. 3/6/9 months; ** p < 0.01 differences between initial vs. 3/6/9 months; # p < 0.05 differences between 3 months vs. 6/9 months.

