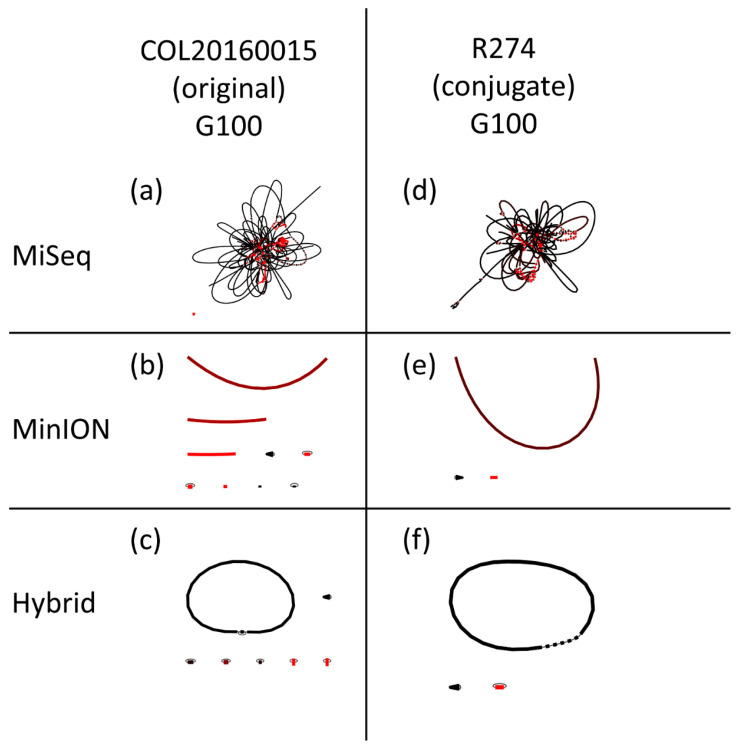
Figure 2.
Visualizations of the assembly graphs with Bandage of the MiSeq, MinION and hybrid assemblies performed on the whole-genome DNA extractions (Genomic Tip 100) of the original E. coli COL20160015 (a–c) and the conjugate R274 (d–f). Each line represents a contig, and a red line represents a contig occurring in higher coverage compared to the other contigs within the same assembly. The thinner black lines are the most likely paths between contigs.

