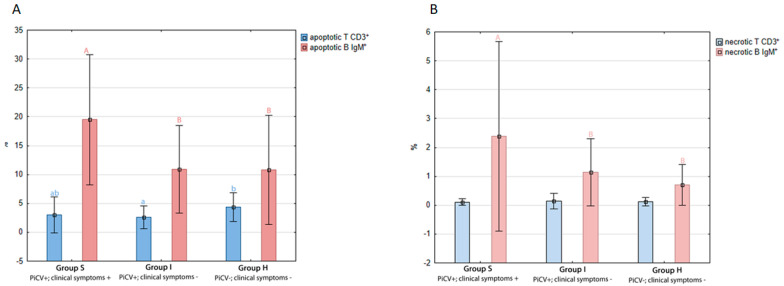
Figure 3.
The results of the flow cytometry analyses. The samples were standardized to 1 × 10⁶ of mononuclear cells. (A) The mean percentage and the ratio of apoptotic (early apoptosis) T CD3+ to B IgM+ splenic lymphocytes isolated from the examined pigeons. (B) The mean percentage and the ratio of necrotic and late apoptotic T CD3+ to B IgM+ splenic lymphocytes isolated from the examined pigeons. The different letters (A,B,C or a,b) indicate a statistically significant difference between investigated groups (p < 0.01 and p < 0.05, respectively) in the Kruskal–Wallis non-parametric test for independent samples. Error bars represent the standard error of the mean.

