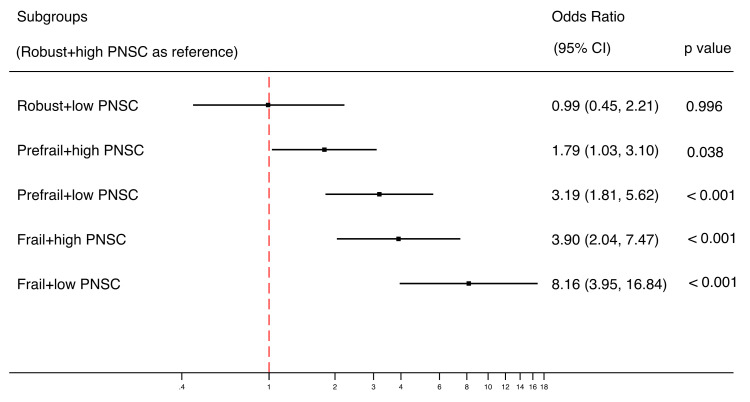
Figure 2.
Combined relationships of PF and PNSC on functional disability using logistic model (n = 1616). A forest plot was used to display the estimated odds ratios (exponential form) for each group compared with the reference group (group of robust older adults with high PNSC), not comparing groups with each other. The analysis was adjusted for demographic, medical and psychological covariates.

