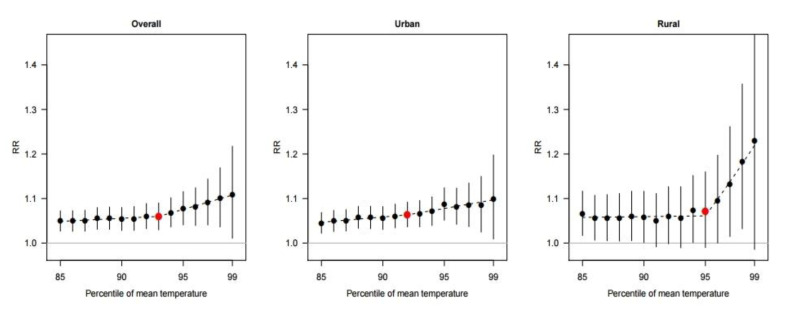
Figure 2.
Associations between the percentile of the mean temperature and pooled heatwave-related mortality risk (RR) in the total, urban, and rural areas with 95% confidence interval (vertical lines). The dashed line indicates the relative risk based on the piecewise regression (a V-shape regression) model. The red points indicate the estimates at threshold points.

