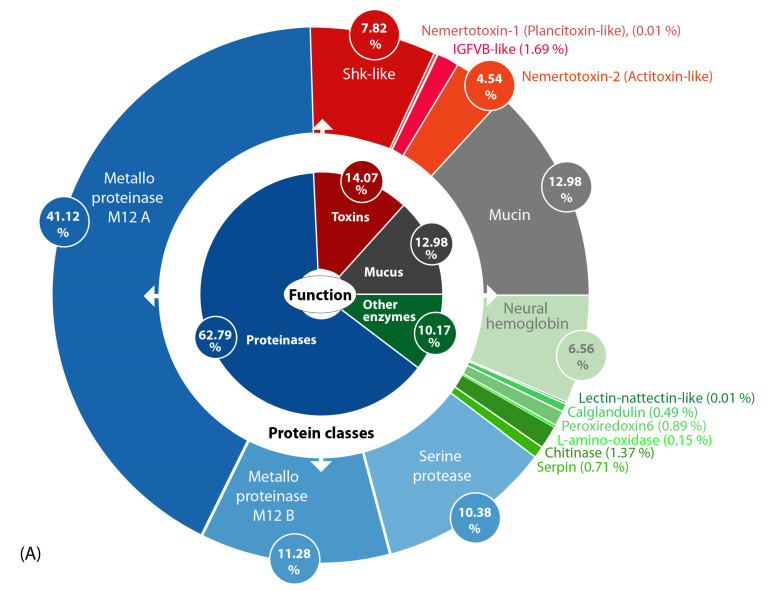
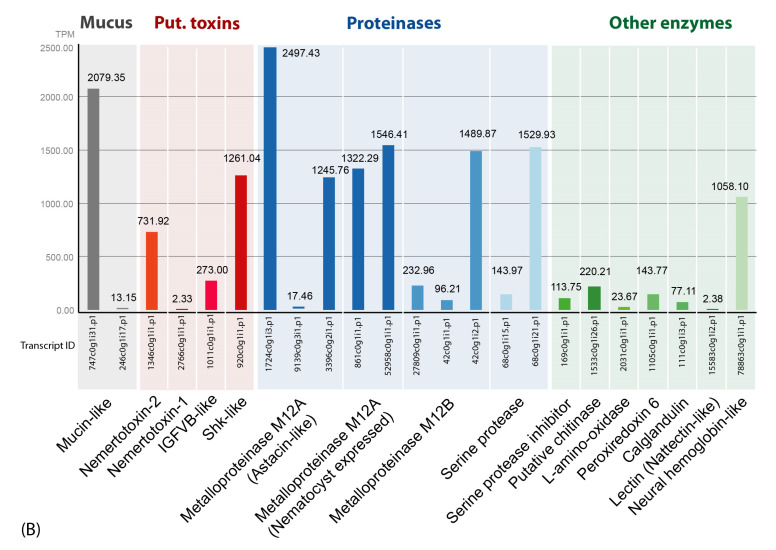
Figure 2.
(A) Overview of toxin composition and identified putative toxin protein classes (outer circle) in the skin and mucus secretions of A. lactifloreus according to biological function (inner circle). The values reflect the percentage TPM (transcripts per million) values of transcripts grouped in the corresponding protein classes. (B) Bar chart showing the expression level for each transcript in TPM values (only transcripts identified by Mascot-based analysis (Table S2) are included).


