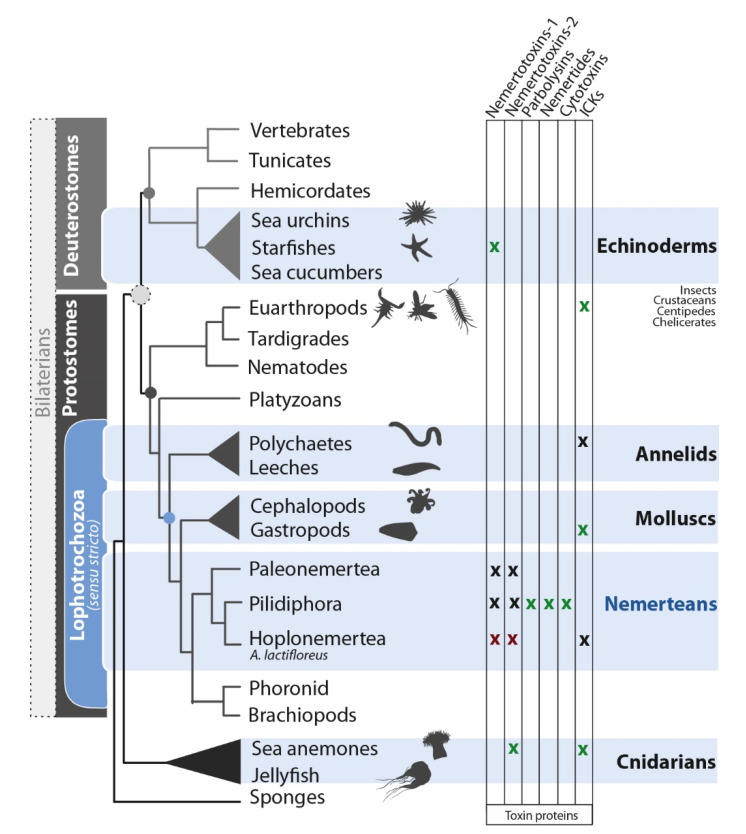
Figure 4.
A cladogram illustrating the relationships among venomous, marine animal lineages (emphasis on nemerteans), showing the distribution of toxin protein classes. A green x indicates a known characterized toxin, a red x indicates proteotranscriptomic matches from A. lactifloreus, and a black x indicates toxin candidates supported by transcriptome data alone. The phylogeny is based on a recent genomics analysis [3]. Some lineages have been pruned for simplicity.

