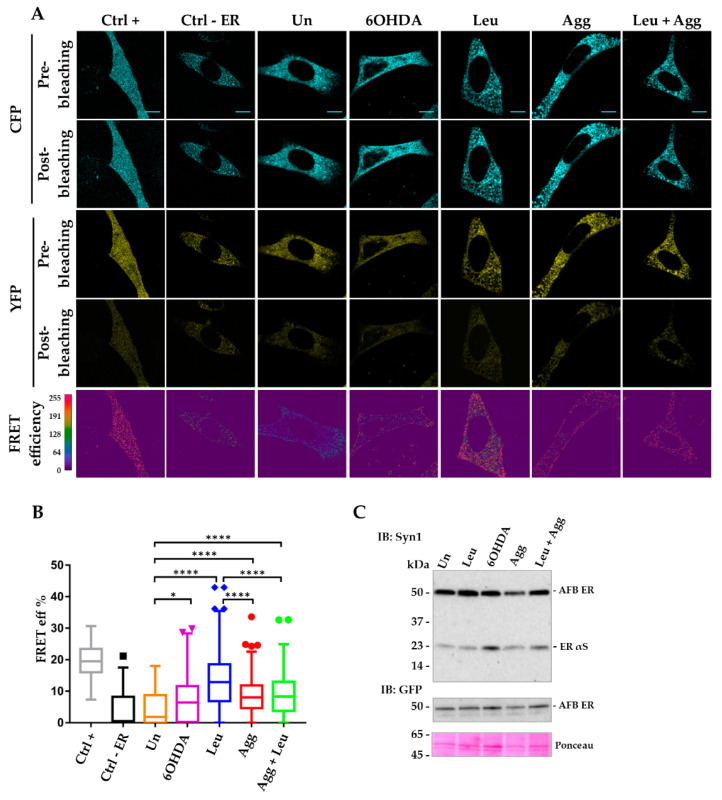
Figure 3.
FRET analysis of inter-AFB ER expressed in i36 cell line highlights early αS structural variation under pro-aggregating conditions. Doxycycline-induced i36 cells were transiently transfected with inter ER AFB or positive (Ctrl +) and negative (Ctrl-ER) controls. The day after cells were treated with pro-aggregating stimuli (Leupeptin, Leu; 6-hydroxydopamine, 6OHDA; microsomes-associated αS aggregates, Agg) and fixed for FRET analysis or lysed for western blot (WB) after 24 h. (A) FRET images were acquired in the donor (CFP) and acceptor (YFP) channels, before and after photobleaching (pre- and post-bleaching) the acceptor. FRET efficiency, calculated by the FRET Wizard Leica Confocal Software, showed regions of higher FRET values (red regions) in all samples treated with stimuli compared to untreated conditions and Ctrl-. Scale bar, 10 μm. (B) Box plot of FRET efficiency of samples in A expressed as percentage were obtained using the formula (Dpost-Dpre)/Dpost. Each box plot shows the median (50th percentile), values to the 1.5 interquartile range (whiskers), 25th to 75th percentile range (box). Circles, triangles and rhombi outside the boxes represent outliers. One-way ANOVA followed by Dunn’s multiple comparison test. * (p < 0.05); **** (p < 0.0001). (C) WB analysis of Tx-S fraction of cell lysates transfected with inter-AFB ER in untreated and treated conditions. Immunoblotting with Syn1 or GFP antibody indicated the correct expression of the inter-AFB ER at the expected size of about 50 kDa in stimulated and control conditions.

