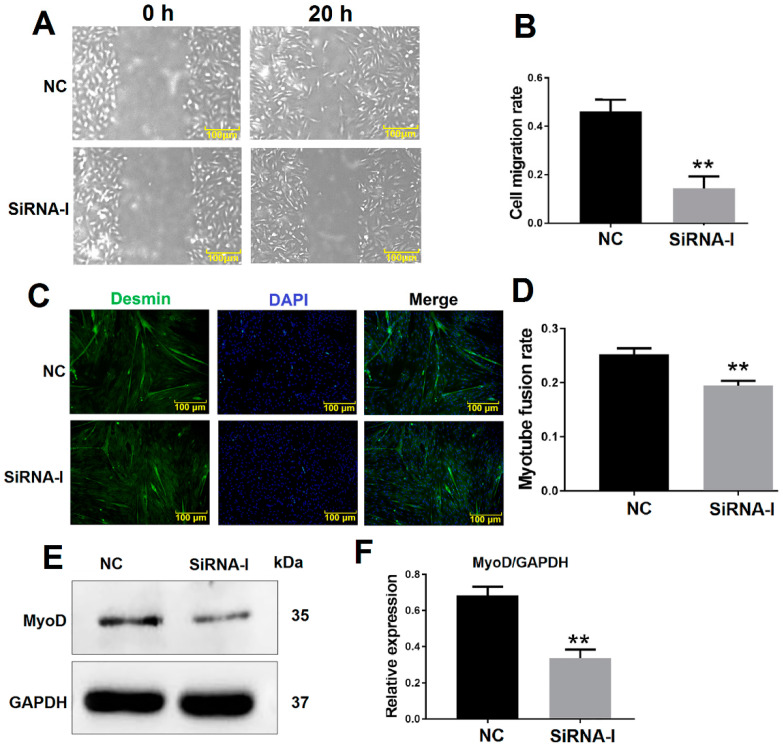
Figure 2.
ITGB1 influences muscle-derived satellite cell (MDSC) migration and differentiation. (A) Cell scratch assay images 20 h after ITGB1 inhibition. (B) Quantification of the cell migration rate 20 h after ITGB1 inhibition as presented in (A). (C) Desmin immunofluorescence staining in MDSCs 48 h after ITGB1 inhibition. (D) Quantification of the myotube rate based on (C). (E) Western blotting results of MyoD expression 48 h after ITGB1 inhibition. (F) Quantification of the MyoD Western blotting results presented in (E). Scale bar = 100 μm. ** p < 0.01.

