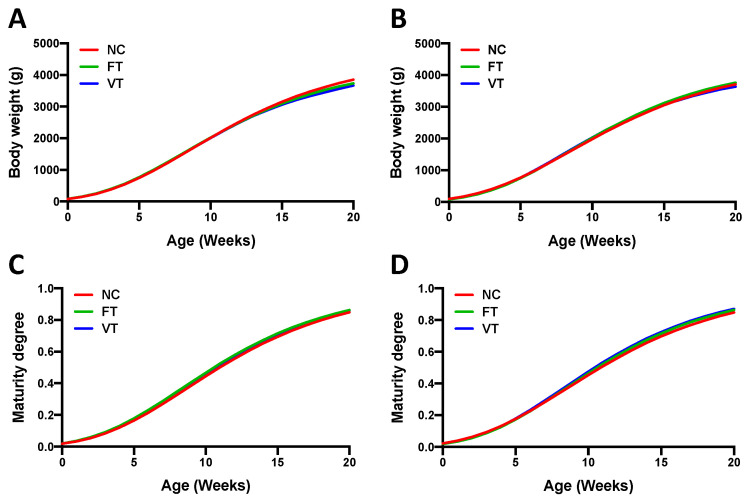
Figure A1.
Gompertz curves comparing the growth between naturally conceived (NC), fresh-transferred (FT), and vitrified-transferred (VT) progenies of the (A) paternal crossbred generation and (B) maternal crossbred generation. Maturity curves of the NC, FT, and VT progenies of the (C) paternal crossbred generation and (D) maternal crossbred generation.

