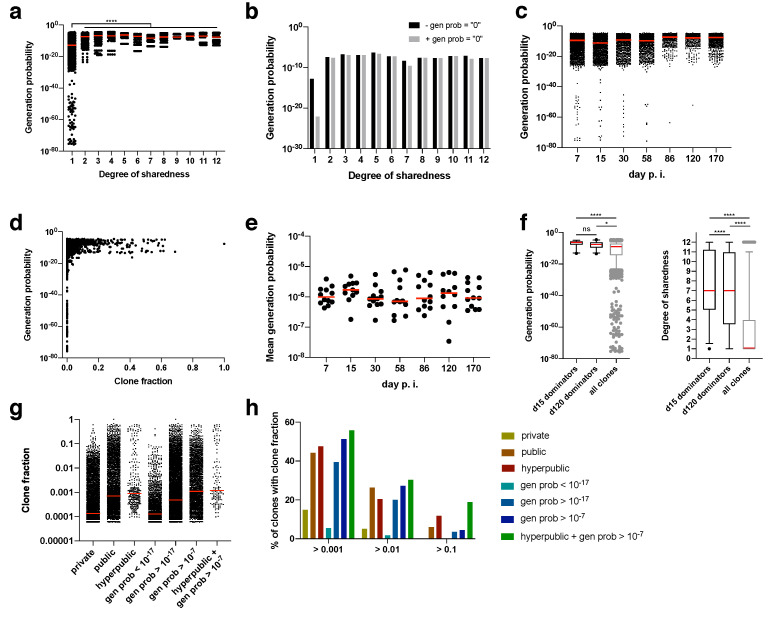
Figure 4.
Association of generation probabilities with degree of sharedness and clone fraction. (a) Generation probabilities of CDR3β sequences for different degrees of sharedness (maximum degree of sharedness 12/12; data from all mice and time points pooled); clonotypes for which no generation probability could be calculated were not included in this depiction; medians are shown in red. (b) medians from (a) without (black) or with (gray) clonotypes for which no generation probability could be calculated (gen prob = “0”); (c) as in (a), but over time post infection, statistical testing by Kruskal-Wallis test (****) followed by Dunn’s multiple comparisons test (shown are results for comparisons of each day from day 86 onwards tested against each day until day 58); **** p value < 0.0001; (d) as in (a), but against clone fraction at a given time point in a given mouse; (e) mean generation probability over time post infection; each dot represents one mouse repertoire for a given time point; (f) generation probabilities for dominators (i.e., clones with a clone fraction >0.1) at day 15 and day 120 post infection, in comparison to all clones; medians in red, boxes indicate 95% confidence interval; statistical testing by Kruskal-Wallis test (****) followed by Dunn’s multiple comparisons test; ns non-significant, * p value < 0.05, **** p value < 0.0001; (g) Clone fraction of clones with specified filters from all mice and time points pooled; (h) data from (g), but percentage of clones with a clone fraction above the indicated values (below the bars) depending on the filters (shown on the right); all data come from non-thymectomized animals.

