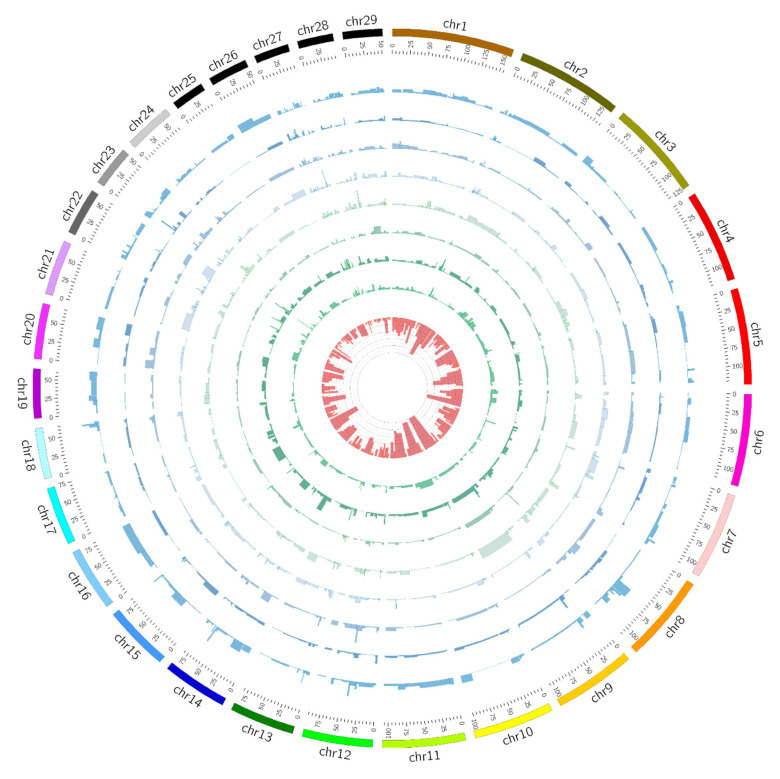
Figure 3.
Circos plot illustrating ROH regions and association results for eight traits. Association significance test for each of ROH was plotted based on −log10 (p) values using histograms within the gray inner circle. The ROH frequency was determined by occurrence of ROH with each region within the population. The estimated frequency values were shown in the innermost circle. The outermost circle displays the cattle autosomes. The circles from inside to outside represent association results for body height, body length, chest circumference, fat coverage, backfat thickness, ribeye area, carcass length, and slaughter weight, respectively.

