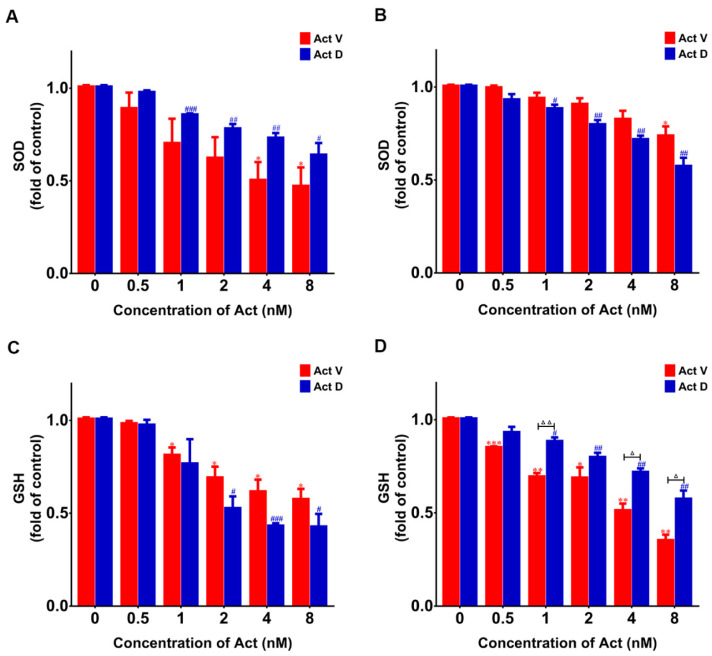
Figure 8.
Act D down-regulated superoxide dismutase (SOD) and glutathione (GSH) levels. Results obtained using SOD and GSH kits. (A) Compared with the control group, actinomycin reduced SOD in LO-2 cells. (B) Compared with the control group, actinomycin reduced SOD in 293T cells. (C) Compared with the control group, actinomycin reduced GSH in LO-2 cells. (D) Compared with the control group, actinomycin reduced GSH in 293T cells. Experiments were repeated three times: * p < 0.05; ** p < 0.01; *** p < 0.001 vs. Act V 0 nM; # p < 0.05; ## p < 0.01; ### p < 0.001 vs. Act D 0 nM; △ p < 0.05; △△ p < 0.01 vs. Act D.

