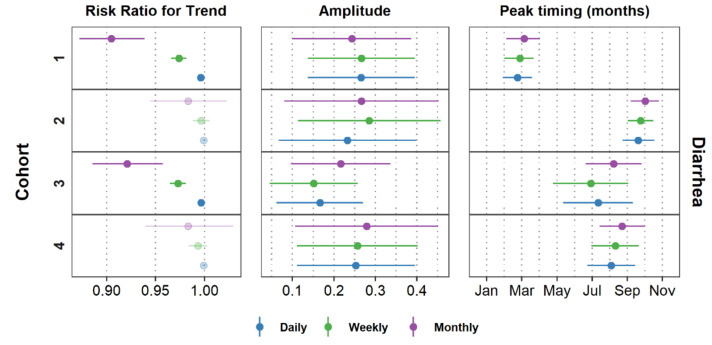
Figure 9.
Estimates and confidence intervals for trend, amplitude, and peak timing of diarrhea for all aggregation levels. Faded symbols indicate estimates that had a p-value > 0.05. Estimates for ALRI and AURI are shown in Figure A1 in the Appendix A.

