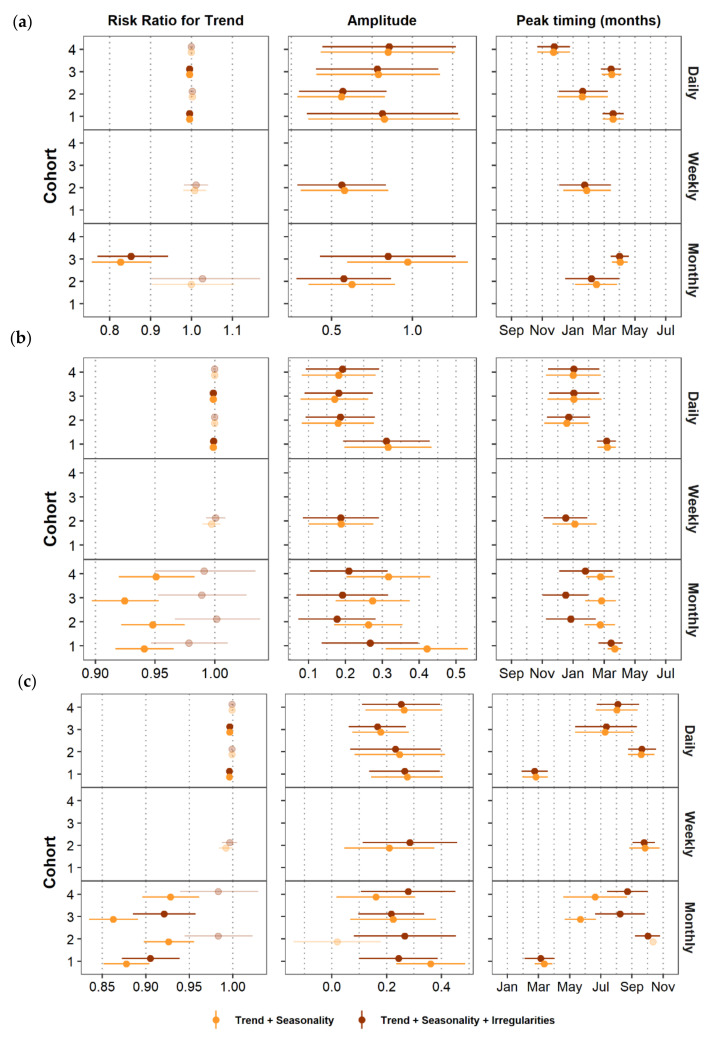
Figure 10.
Effect of omitting aggregation irregularities on estimates and confidence intervals for trend, amplitude, and peak timing of (a) ALRI, (b) AURI, and (c) diarrhea for all aggregation levels. Faded symbols indicate estimates that had a p-value > 0.05. The confidence interval for peak timing of monthly Cohort 2 data is not shown since it was calculated as 305 days.

