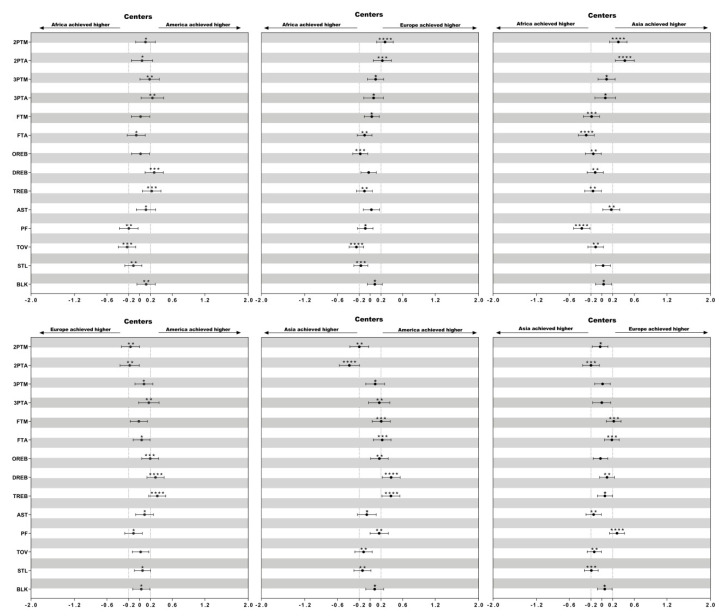
Figure 1.
Standardized differences of technical performances in centers among different continental championships. Bars present 90% confidence intervals. Asterisks indicate the likelihood for the magnitude of the true difference as follows: * possible; ** likely; *** very likely; **** most likely. Asterisks located in the area between −0.2 and 0.2 denote for trivial differences.

