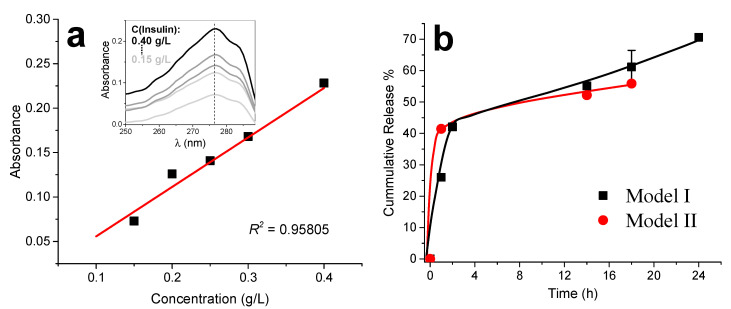
Figure 12.
(a) Insulin standard calibration curve obtained by UV spectrophotometry for the absorbance measured at 276 nm wavelength. Inset shows the UV spectra obtained for the different insulin standard concentrations. (b) Cumulative insulin release from chitosan-caseinate nanoparticles obtained following the Model I and II approaches of Scheme I, as determined by UV spectrometry at 276 nm wavelength.

