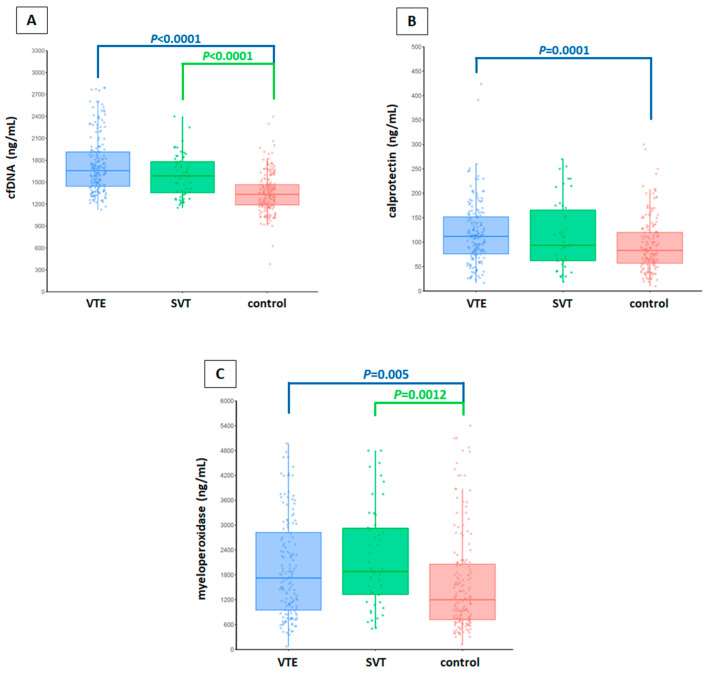
Figure 1.
Levels of each neutrophil activation marker in plasma of the clinical groups studied (lower extremity VTE, SVT, and healthy controls). (A) cfDNA levels. (B) calprotectin levels. (C) myeloperoxidase levels. In each graph the median concentration of the marker studied is represented as a dark line. The lower and upper lines of each box represent the first and third quartile, respectively. The length of the whiskers indicates 1.5 interquartile ranges. The observations are represented as circles. Differences in the levels of each neutrophil activation marker between patients and controls were analyzed with linear regression models. All experiments were performed in duplicate. Results were considered statistically significant at p < 0.05. All statistical analyses were performed using R (version 3.5.1). VTE, lower extremity venous thromboembolism; SVT, splanchnic vein thrombosis.

