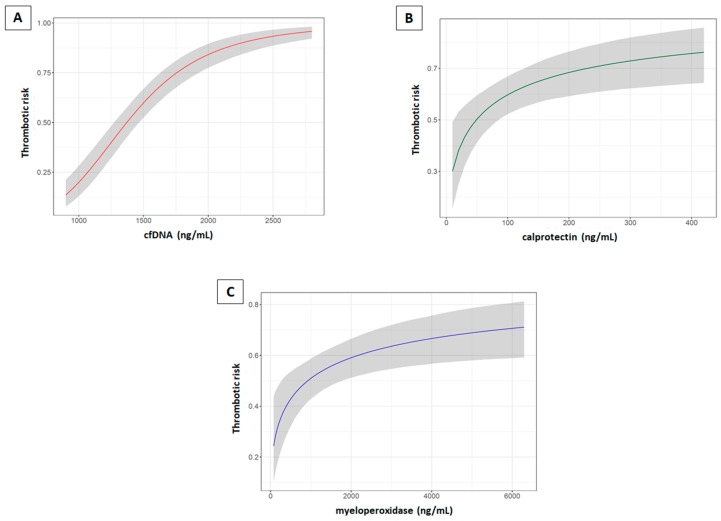
Figure 2.
Conditional effects plots that depict the variation of the thrombotic risk according to the values of each neutrophil activation marker studied. (A) cfDNA. (B) Calprotectin. (C) Myeloperoxidase. These conditional effects plots reveal how the risk of VTE varies dynamically with the increase in the levels of each neutrophil activation marker studied, according to the fitted logistic regression models. As a result, the probability of VTE of a given individual is more accurately estimated for every concentration of the marker studied given that the VTE risk is not estimated by distributing the levels of the marker in several ranges, e.g., like quartiles or percentiles. The solid line represents the average and the shaded area represents the 95% CI values.

