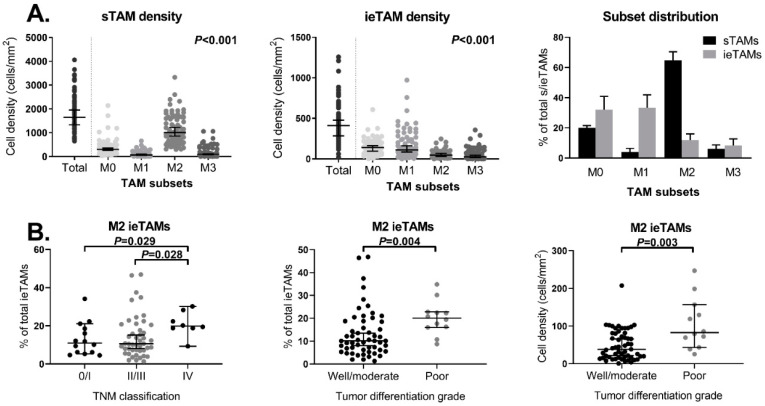
Figure 5.
Distribution of the TAM subsets in the stromal and intraepithelial compartments of primary colorectal tumors as measured by multiplex immunofluorescence in relation to clinicopathological parameters. (A) Distribution of the sTAM and ieTAM subsets (CD68+iNOS−CD163− M0, CD68+iNOS+CD163− M1, CD68+iNOS−CD163+ M2 and CD68+iNOS+CD163+ M3 TAMs) in primary colorectal tumors (N = 72 and N = 68, respectively). (B) Associations between the percentage of M2 ieTAMs and TNM stage (stage 0/I, N = 14; stage II/III, N = 46; stage IV, N = 8), and between the percentage of M2 ieTAMs and M2 ieTAM density and tumor differentiation grade (well/moderate, N = 55; poor, N = 12) in primary colorectal tumors. The bars show the median with a 95% CI. Statistically significant p-values (≤0.05) are indicated in bold. Abbreviations: CI (confidence interval), CRC (colorectal cancer), iNOS (inducible nitric oxide synthase), ieTAM (intraepithelial TAM), sTAM (stromal TAM), TAM (tumor-associated macrophage), TNM (Tumor, Node, Metastasis).

