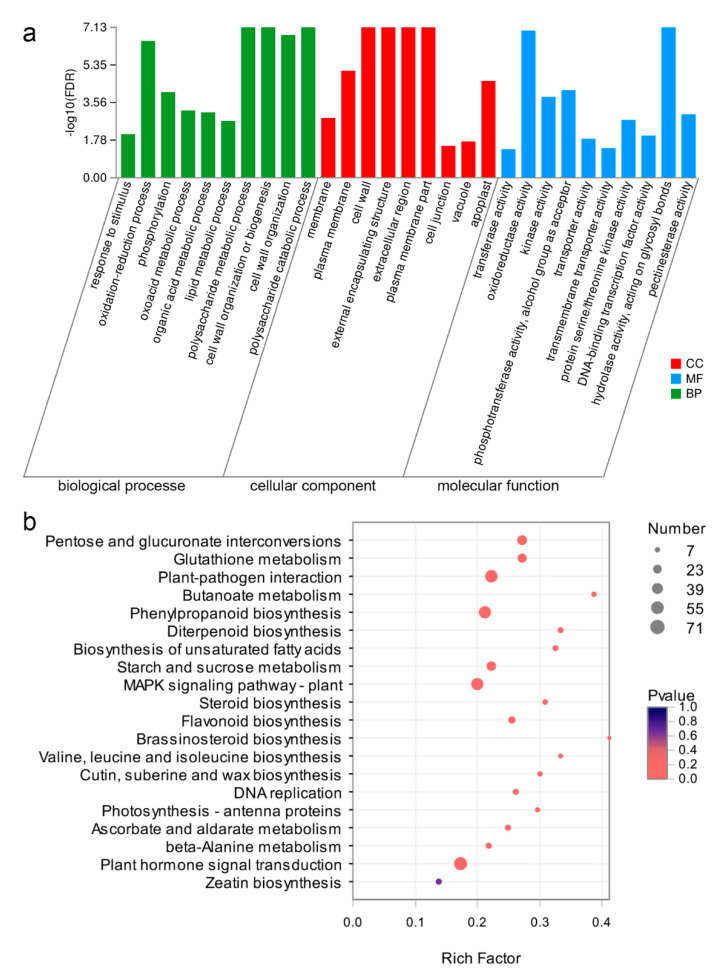
Figure 3.
The Gene Ontology (GO) and (Kyoto Encyclopedia of Genes and Genomes) KEGG enrichment analysis of DEGs. (a) The GO enrichment analysis. The top ten enriched biological processes, molecular function and cellular component GO terms for DEGs. The x-axis represents GO term. The y-axis represents the significance level of enrichment (−log10 FDR—false discovery rate). (b) The KEGG enrichment scatter plot of DEGs. The y-axis represents the name of the pathway, and the x-axis represents the rich factor, the degree of KEGG pathway enrichment. Top 20 KEGG pathway enrichments with DEGs were showed. Dot size represents the number of genes and the color indicates the p-value.

