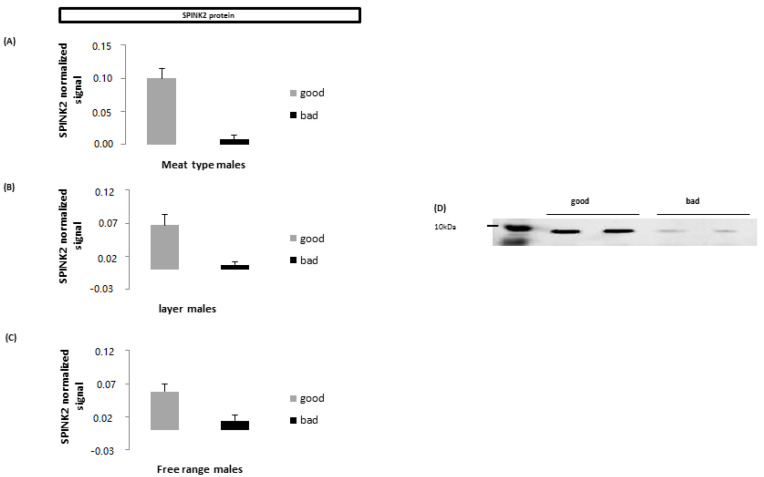
Figure 2.
(A,B,C): respective seminal plasma intensity of the signal of SPINK2 protein in highly fertile males (grey) or in subfertile males (black: less than 40% fertility) [19] of 3 highly different lines of chicken (A): Meat line; (B): Laying line; (C): free range line. (D): western blott representation of differences of seminal SPINK2 amount in seminal plasma of highly fertile (good) and subfertile (bad) meat type males. Differences between “good” and “bad” males are highly significant in all cases. (Extracts from Thélie et al. [22]).

