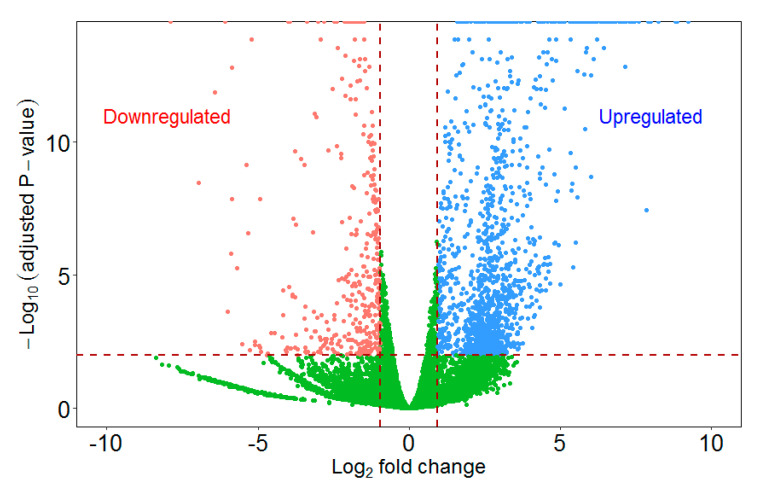
Figure 3.
Volcano plot of differentially up- and downregulated genes in the infected zooids relative to the uninfected control zooids. A volcano plot shows the relationship between the p-values of a statistical test and the magnitude of the difference in expression values. On the y-axis the negative log10 p-values are plotted. On the x-axis the log2 values of the fold changes seen in whole transcriptome comparison.

