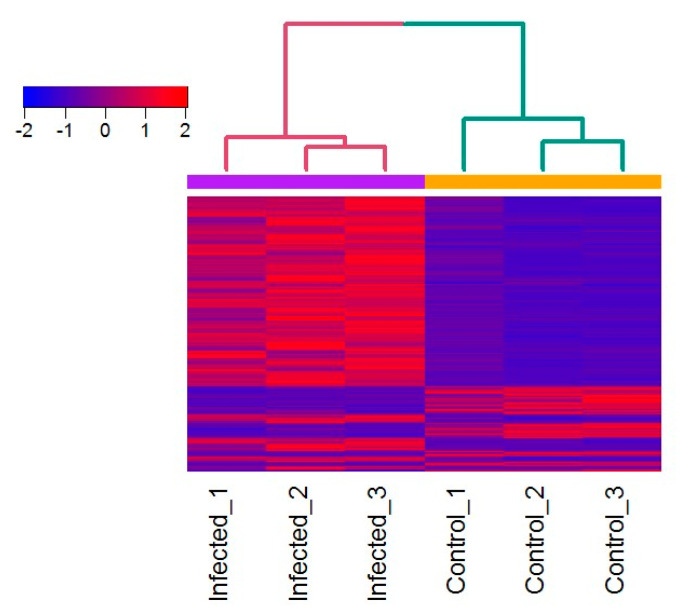
Figure 4.
Heatmap showing the expression patterns of genes in the zooid samples. Heatmap of Z scaled RNA-seq normalized TPM values of 1166 differentially expressed transcripts (FDR adjusted p-value: ≤0.01) among the infected and uninfected control zooids. Red indicates upregulation; blue indicates downregulation, as indicated in the color key. Each row represents one gene and each column represents an individual zooid. Euclidean distance and complete linkage method was used for hierarchical clustering.

