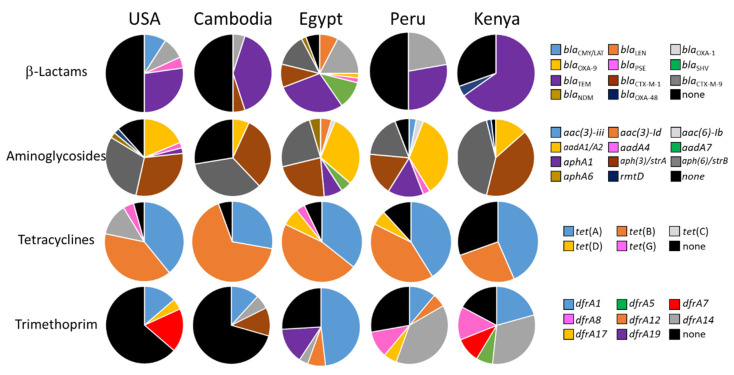
Figure 4.
Pie charts showing carriage rates of ARDs conferring resistance to β-lactams, aminoglycosides, tetracyclines, and trimethoprim among E. coli, Shigella spp., and Salmonella. Black pie slices indicate the percentage of isolates that were negative for all tested ARDs in that category. Note that many strains carried multiple β-lactamase and aminoglycoside ARDs.

