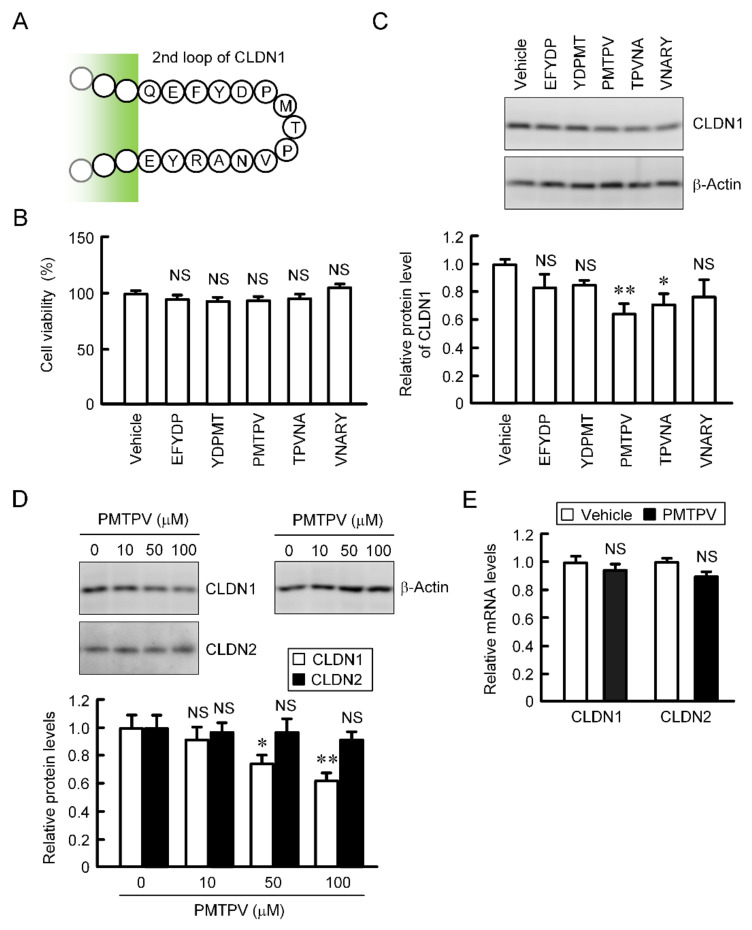
Figure 2.
Effects of short peptides on the expression of CLDN1 in A549 cells. (A) Sequence of ECL2 of CLDN1. (B) A549 cells were incubated with each peptide at 100 μM or without peptide (vehicle) for 24 h. Cell viability was assessed by WST-1 assay. (C) The cell lysates were immunoblotted with anti-CLDN1 and anti-β-actin antibodies. The protein level of CLDN1 is represented relative to the values in vehicle. (D) Cells were incubated with PMTPV for 24 h at the concentration indicated. The protein levels of CLDN1 and CLDN2 are represented relative to the values in 0 μM. (E) Cells were incubated with PMTPV at 100 μM for 6 h. After extraction of total RNA, quantitative real-time PCR was performed using primer pairs for CLDN1, CLDN2, and β-actin. The mRNA levels of CLDN1 (open bars) and CLDN2 (closed bars) are represented relative to the values in vehicle. n = 3–4. ** p < 0.01 and * p < 0.05 compared with vehicle or 0 μM. NS, p > 0.05.

