
Fig. (2).
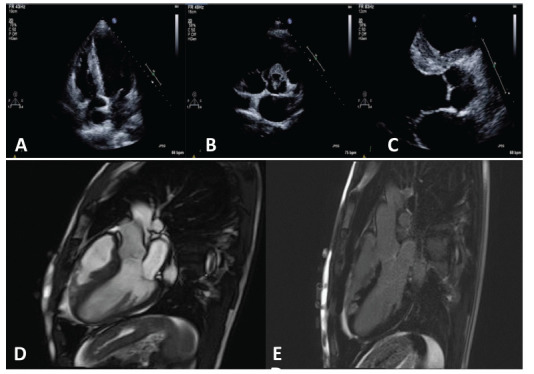
Echocardiographic images (upper panel) demonstrates evidence of echogenic areas of thickening along the right ventricular side of the interventricular septum (A and C) and in the peri-aortic region (B). Corresponding cardiac magnetic resonance imaging demonstrated myocardial oedema in the basal anteroseptum and mid inferoseptum, as well as in the right ventricular outflow tract and moderator band. Patchy and intense late gadolinium enhancement was seen corresponding to the regions of myocardial oedema (D and E). (A higher resolution / colour version of this figure is available in the electronic copy of the article).